Vegetation, fire severity, and hydrology data were collected at 28 rich fen sites in Alberta and the Northwest territories in 2016. These sites were either 1, 2, or 5 years post fire disturbance of different severities. Although bogs are another important type of peatland, they were not sampled for this study since they are ombrotrophic. Since bogs do not receive groundwater, they were not applicable to our study rationale (Magnan et al., 2012).
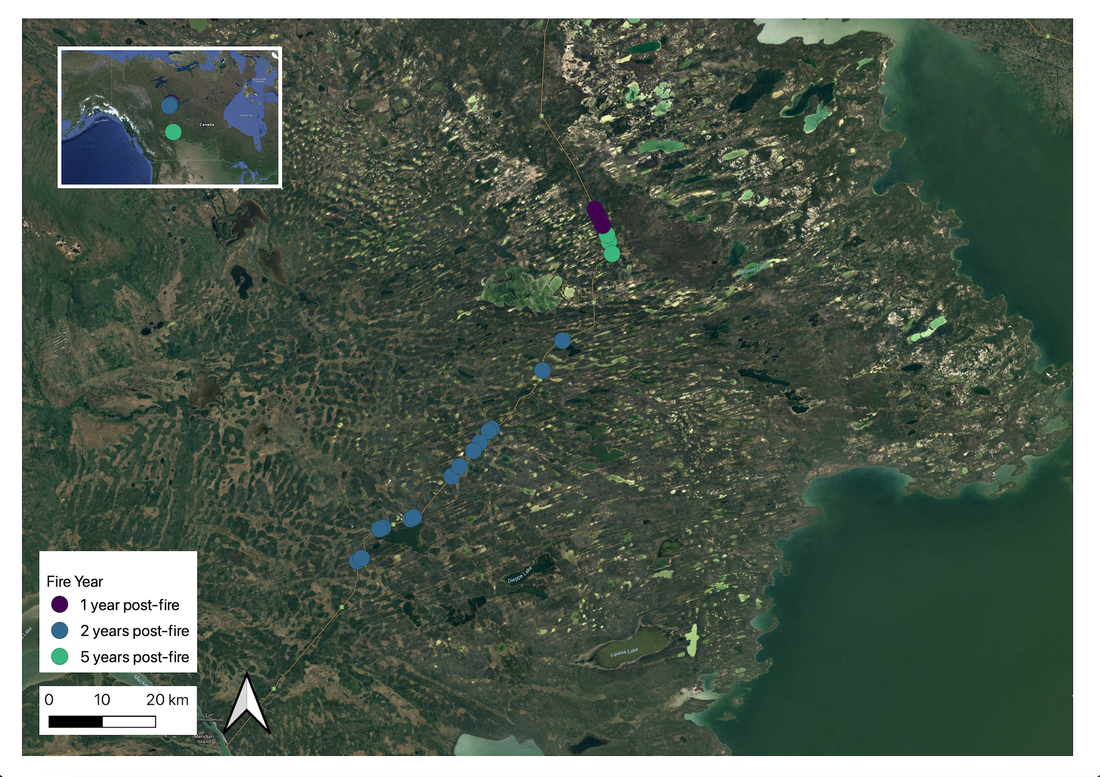
Sites from the NWT
|
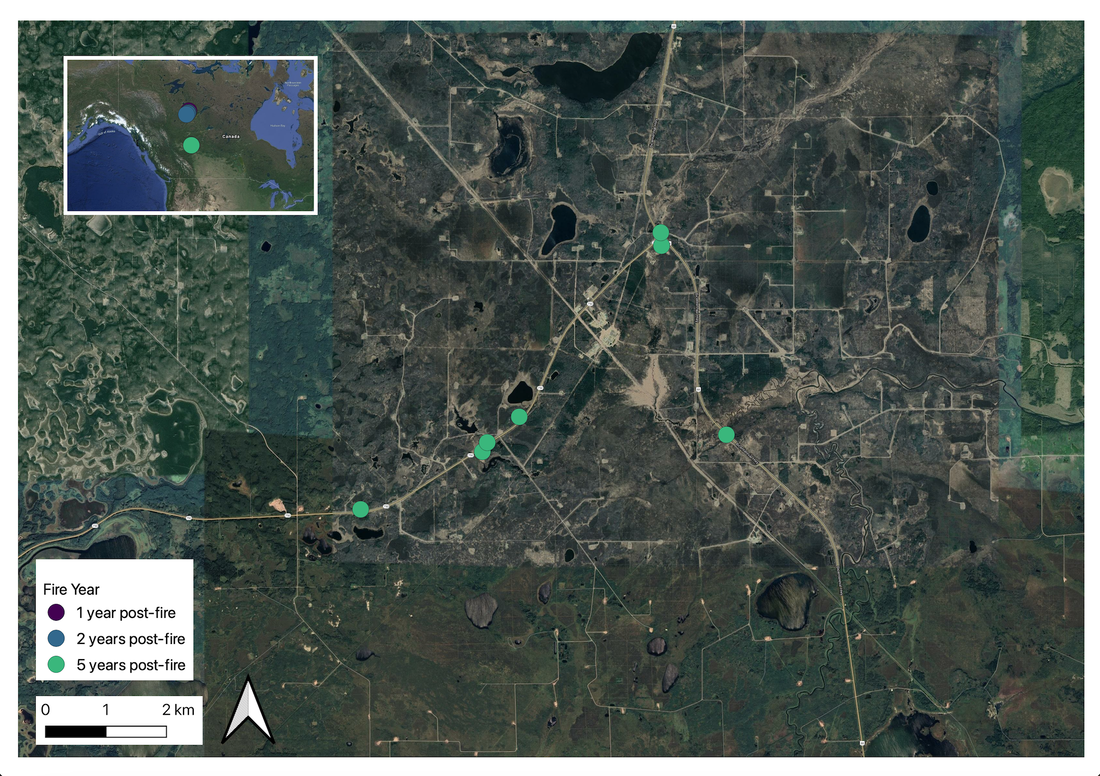
Sites from AB
|
Study Design At each burn site, data was collected from 12 plots, 6 of the plots were on hummocks and 6 were on hollows (Figure 1). These two microsites were sampled to quantify their possible impacts on vegetation regeneration. Starting near the centre of each site, a north facing 300m transect was measured. At 50 m intervals, a hummock and hollow plot were sampled and placed in an alternating fashion about 5 m left or right of the transect. Each plot was 1 m x 1 m. Percent cover of bryophytes in each plot were estimated for vegetation data as a measure of site regeneration. Depth of burn was measured within each plot to quantify fire severities at the sites. Finally, water table levels were measured adjacent to each plot. As the sites were closely grouped together, we could infer that any changes in the water table level would be comparable within the same general areas. This allowed us to use the water table level measurements taken after the fires, which were all recorded on the same day. Specific information on how each variable was measured is illustrated below.
|

Figure 1. Transect design
|
How the variables were measured
|

Figure 2. Carex aquatilis
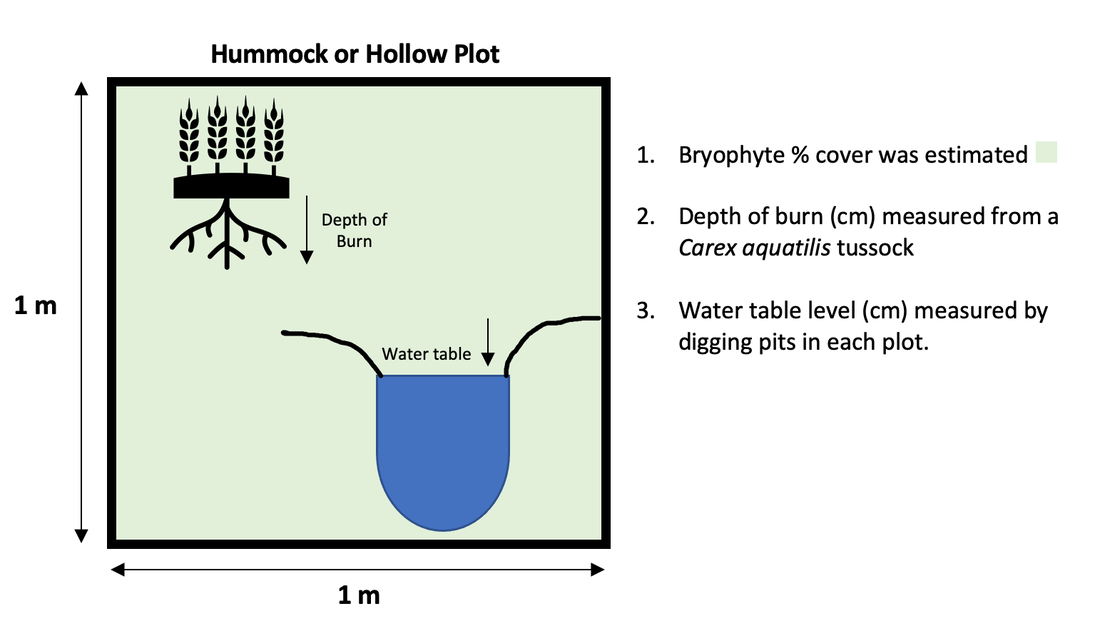
Figure 3. Plot design
|
Data Analysis
Raw data was visualized using graphic exploration in R to check the data for errors and violations of statistical assumptions. As seen above, scatterplots were used to identify any relationships between the continuous predictor and responding variables. However, conclusions are difficult to draw from these plots, so the predictor variables were converted into discrete categories based data distribution. This was done to create boxplots that can more easily be interpreted and to complete a multifactor ANOVA. We evaluated the data to see if it met the ANOVA’s assumptions of normality and homogeneity of variances. Despite not meeting the ANOVA assumptions, we did not transform the data since it did not significantly change the p-values values or CIs, transformations reduce statistical power, and due to the principles of the central limit theorem. While a linear regression would have been a possible alternative to conducting a multifactor ANOVA, collinearity would be an issue with our dataset and could not be statistically accounted for. Several ANOVAs were conducted to analyze the predictor variable influences on depth of burn values and bryophyte cover. The ANOVA was then followed up with pairwise comparisons.
*The data was taken from https://www.polardata.ca/pdcsearch/PDCSearch.jsp?doi_id=12711 . Sampling method of real data described above has been altered from Rochefort and Guene-Nanchen’s design (2017) for the purpose of this academic project to have a more representative scope on the condition of each site.*
